
Why Grocery Prices Vary So Much Between Kenyan Supermarkets
ShelfSight data shows wide differences in supermarket price ranges. But a higher median does not always mean a retailer is simply more expensive — assortment size, brands and product mix can change the picture dramatically.
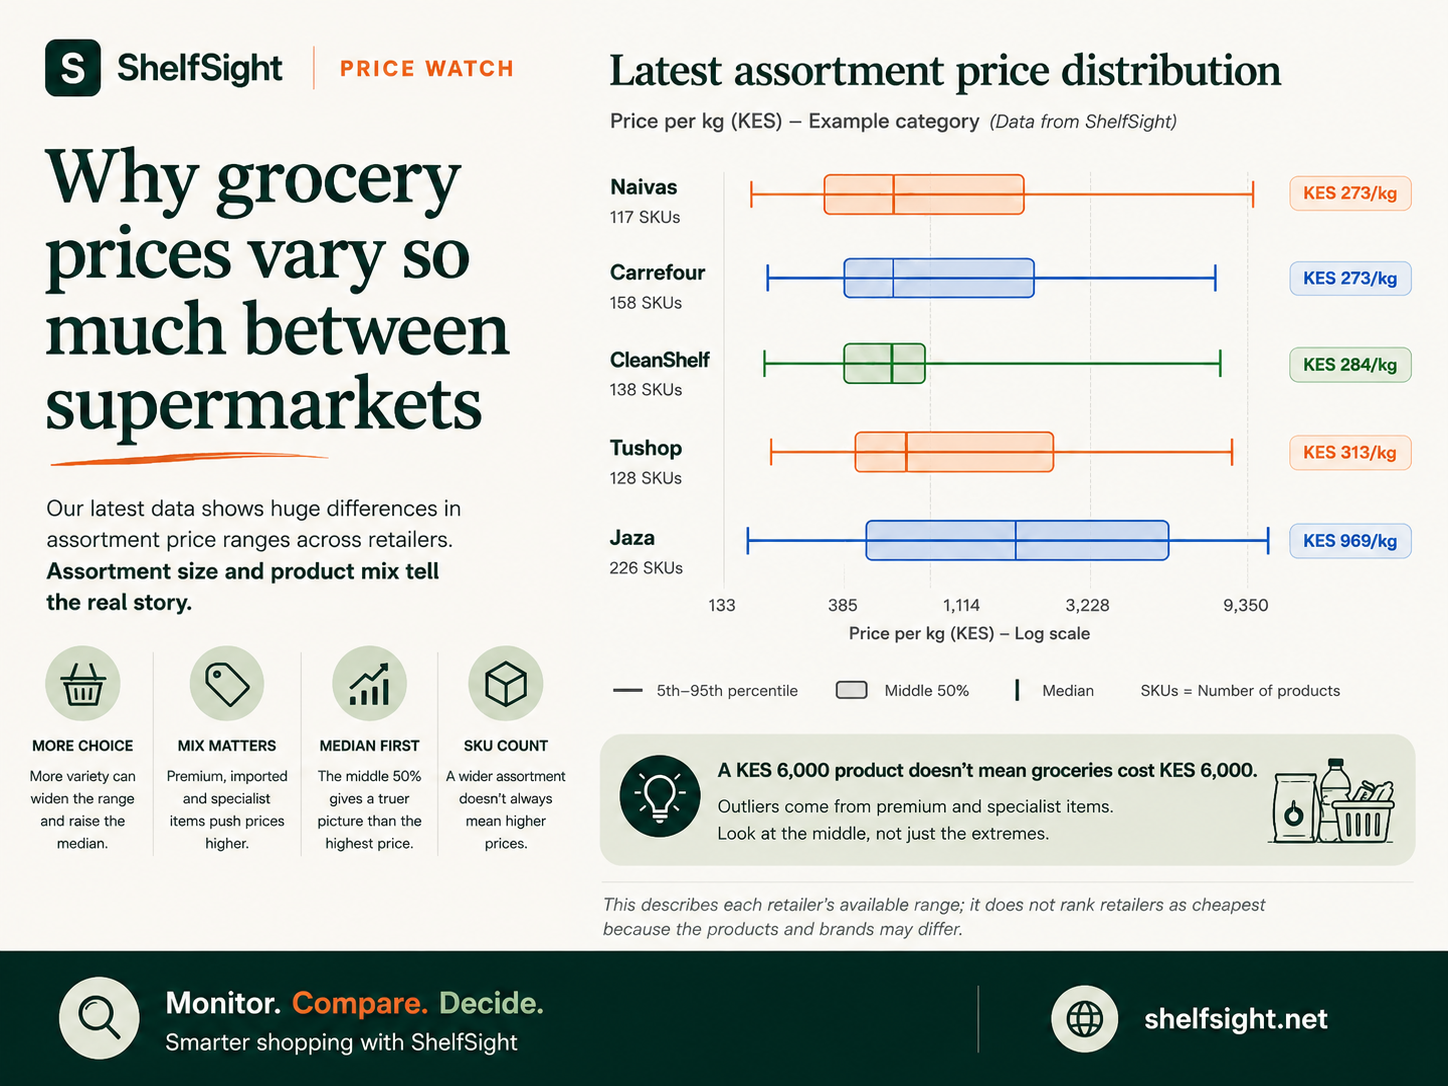
Why Grocery Prices Vary So Much Between Kenyan Supermarkets
Two supermarkets can sell products from the same grocery category and still show dramatically different price ranges.
At first glance, that can make one retailer look cheap and another expensive.
But supermarket pricing is rarely that simple.
ShelfSight's latest assortment data shows that the products a retailer chooses to stock can have just as much influence on its price distribution as the individual prices themselves.
What ShelfSight is measuring
For each retailer, ShelfSight looks at the latest available products within a commodity or category and normalizes prices to a common unit such as:
- KES per kg
- KES per litre
That allows products with different pack sizes to be compared on a more consistent basis.
The distribution then shows:
- Median price — the middle price in the retailer's assortment
- Middle 50% — where the central half of available products sit
- 5th–95th percentile range — the broader available price range while reducing the effect of extreme outliers
- SKU count — how many products are represented
Together, these measures tell us much more than simply looking at the cheapest and most expensive item.
The differences can be huge
Across the categories currently tracked by ShelfSight, the median unit price can vary substantially between retailers.
In one of our latest comparisons, retailer medians ranged from approximately:
- KES 154/kg
- KES 155/kg
- KES 160/kg
- KES 330/kg
- KES 665/kg
- up to around KES 748/kg
That is a very wide spread.
But it would be misleading to immediately conclude that the retailer at KES 748/kg is simply charging several times more for the same products.
The assortment itself may be completely different.
Product mix matters
Imagine two supermarkets selling products in the same category.
Retailer A carries 20 products, mostly mainstream local brands.
Retailer B carries 90 products including:
- value products
- mainstream brands
- larger pack sizes
- imported products
- premium brands
- speciality products
Retailer B may naturally show a much wider price range and a higher median.
That does not necessarily mean the same product costs more there.
It means the mix of products on the shelf is different.
More choice can widen the price range
A larger assortment can introduce more products at both ends of the market.
That can include very affordable products as well as significantly more expensive specialist products.
This is why a supermarket with more SKUs can sometimes show a much broader price distribution.
For example, some ShelfSight categories contain retailers with more than 200 SKUs, while another retailer may have fewer than 20 products in the same broad category.
Those two assortments should not be interpreted in exactly the same way.
A KES 6,000 product does not mean groceries cost KES 6,000
One expensive product can create a dramatic-looking maximum price.
That product could be:
- imported
- premium
- organic
- speciality
- sold in an unusual format
- intended for a very different customer segment
This is why ShelfSight focuses heavily on the middle of the distribution.
The median and middle 50% usually provide a better indication of what a shopper is likely to encounter than the single most expensive product.
The middle 50% tells an important story
The box in ShelfSight's distribution charts represents the middle half of a retailer's assortment.
A narrow box suggests that many products are clustered around a similar unit price.
A wide box suggests much more variation.
This can tell us whether a retailer's assortment is concentrated around a particular market segment or stretches from value products to much more premium options.
Two retailers may even have similar median prices while having very different assortment structures.
That difference matters.
SKU count gives the price context
Price without assortment size can be misleading.
A retailer with 12 products and a median of KES 155/kg is not necessarily directly comparable to a retailer with 96 products and a median of KES 665/kg.
The second retailer may simply offer many more types of products.
That is why ShelfSight shows the SKU count alongside the price distribution.
It answers an important question:
> How much choice sits behind this number?
So which supermarket is cheapest?
This chart alone does not answer that question.
And that is intentional.
Assortment distributions describe the products each retailer currently offers.
They do not prove that one retailer is cheapest for identical products.
To answer that question properly, ShelfSight needs to compare:
- the same product
- the same brand
- the same pack size
- or a carefully normalized equivalent
That is where matched product comparisons and basket comparisons become more useful.
What the assortment chart does tell us
It helps answer a different set of questions:
- Which retailers offer the widest choice?
- Which assortments are concentrated around lower price points?
- Which retailers carry more premium products?
- Where is the price range particularly wide?
- Which categories show the biggest differences in product mix?
These are useful signals for both shoppers and anyone trying to understand supermarket pricing.
ShelfSight will keep watching
A single distribution is only a snapshot.
The more interesting story begins when we track these distributions over time.
We can then ask:
- Are median prices moving up or down?
- Is a retailer expanding its assortment?
- Are more premium products entering the category?
- Is the middle price range becoming more expensive?
- Are retailers becoming more competitive?
That is the purpose of Price Watch.
Not just to show today's number, but to understand how supermarket pricing changes over time.
Monitor. Compare. Decide.
---
*ShelfSight price distributions describe the assortment available in our dataset at the time of analysis. They should not be interpreted as a ranking of retailers from cheapest to most expensive because brands, products, pack sizes and assortment mix may differ.*